
Environmental Action Impact Calculator
Your Impact Assessment
Select actions you take to see which environmental problem groups you're helping address.
Your Combined Impact
Your selected actions address multiple environmental problem groups:
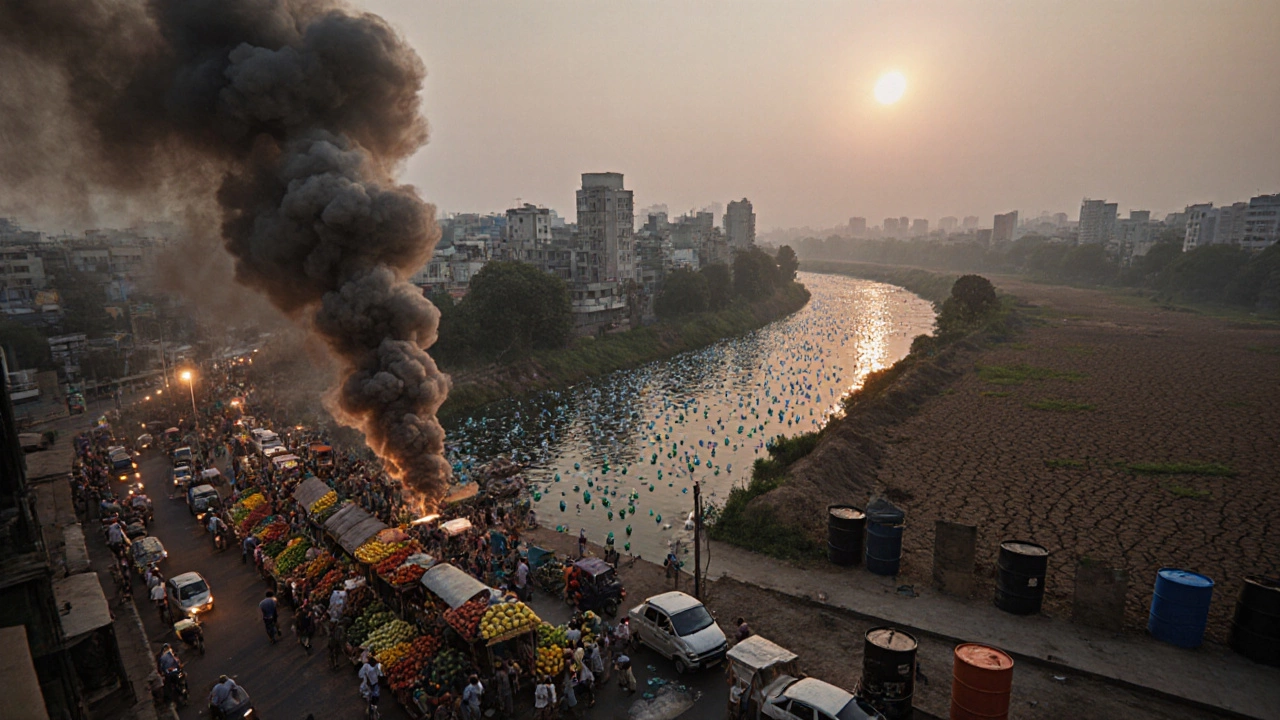
Ever wonder why headlines keep shouting about plastic, heatwaves, and disappearing animals? The answer lies in three big environmental problem groups that drive most of today’s ecological crises.
Key Takeaways
- The three primary groups are Pollution, Climate Change, and Biodiversity Loss.
- Each group contains multiple sub‑issues that often overlap.
- Real‑world examples illustrate how these problems affect everyday life.
- Individual actions, community projects, and policy shifts can tackle each group.
- A quick reference table helps you compare the groups at a glance.
What Are the Three Main Environmental Problem Groups?
When experts talk about the "big picture" of ecological risk, they usually cluster concerns into three overarching categories. These categories help policymakers, NGOs, and citizens focus resources where they matter most.
Environmental problem groups are broad classifications that group related ecological threats, making it easier to study causes, impacts, and solutions. The three groups are:
- Pollution
- Climate Change
- Biodiversity Loss
Group 1 - Pollution
Pollution refers to the introduction of harmful substances or energy into the environment, degrading air, water, and soil quality. It’s the most visible of the three groups because you can often see or smell its effects.
Key sub‑categories include:
- Air Pollution - particulates, nitrogen oxides, and sulfur dioxide that cause respiratory diseases and contribute to acid rain.
- Water Pollution - plastics, heavy metals, and nutrient runoff that lead to dead zones and unsafe drinking water.
- Soil Degradation - pesticides, industrial waste, and over‑tilling that strip soil of nutrients and biodiversity.
Globally, the World Health Organization estimates that 7million premature deaths each year are linked to air pollution alone. In the UK, the 2024 Clean Air Report recorded a 15% rise in fine‑particle concentrations in urban centers, a direct threat to public health.
Group 2 - Climate Change
Climate Change describes long‑term shifts in temperature, precipitation, and wind patterns driven primarily by human‑generated greenhouse gases. It’s the “slow‑burn” crisis, but its impacts are accelerating.
Core drivers include:
- Greenhouse Gases - carbon dioxide, methane, and nitrous oxide that trap heat in the atmosphere.
- Deforestation and land‑use change, which both release stored carbon and reduce the planet’s ability to absorb CO₂.
- Fossil‑fuel combustion across transport, industry, and power generation.
According to the 2023 IPCC report, global average temperatures have already risen 1.2°C above pre‑industrial levels, pushing many ecosystems toward tipping points. The UK’s Met Office recorded the hottest year on record in 2022, with heat‑wave days up 40% since 1970.
Group 3 - Biodiversity Loss
Biodiversity Loss encompasses the decline in variety of life at genetic, species, and ecosystem levels, threatening food security, health, and cultural heritage. It often flies under the radar because the effects are indirect yet profound.
Major contributors are:
- Habitat destruction - from urban sprawl to agricultural expansion.
- Overexploitation - overfishing, illegal wildlife trade, and unsustainable logging.
- Invasive species - non‑native organisms that outcompete native flora and fauna.
- Pollution - especially plastic and chemical runoff that harm marine and terrestrial species.
The WWF’s 2024 Living Planet Index shows a 69% average decline in vertebrate populations since 1970. In the UK, hedgerow loss of 12% over the past two decades has reduced habitats for pollinators, contributing to the 30% drop in honeybee numbers.
How the Three Groups Interact
Although listed separately, Pollution, Climate Change, and Biodiversity Loss are tightly linked. For example, air pollutants like black carbon accelerate glacier melt, a climate‑change effect, while warming seas boost coral bleaching, directly causing biodiversity loss. Similarly, plastic waste (a pollution issue) entangles marine life, pushing species toward extinction.
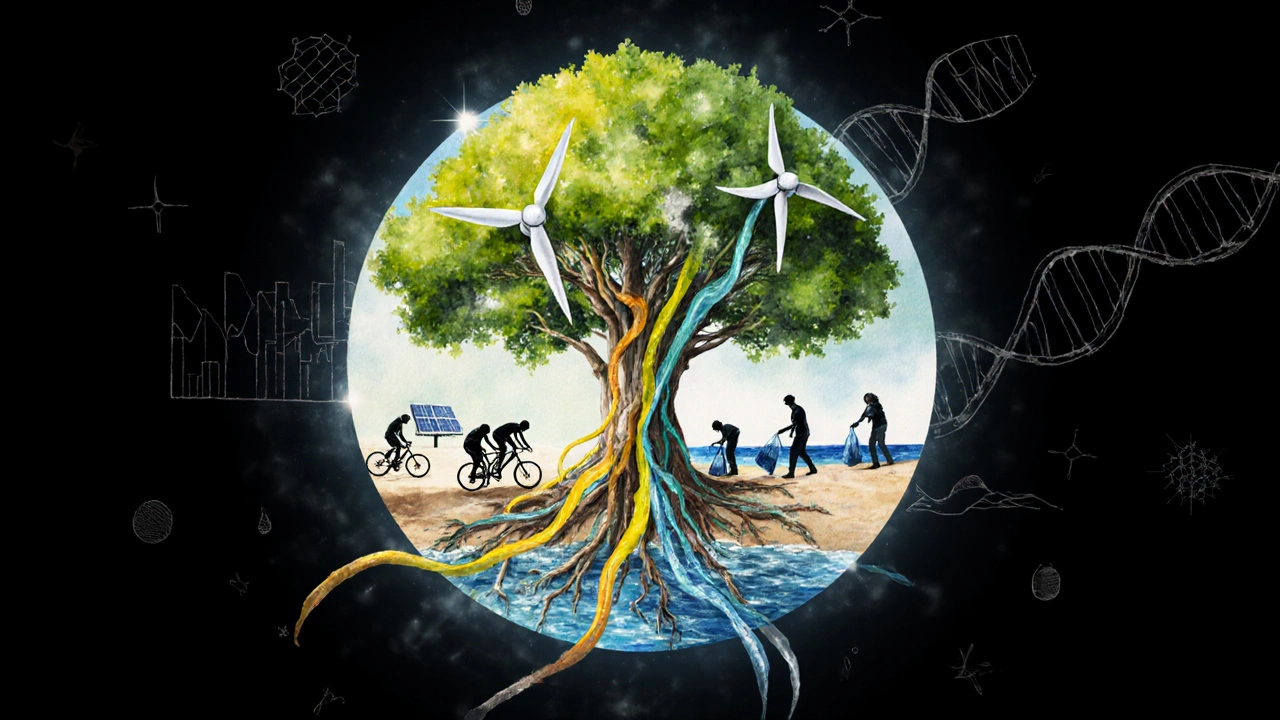
Understanding these feedback loops helps create solutions that address multiple problems at once. A single policy, such as shifting to renewable energy, cuts greenhouse‑gas emissions, reduces air‑pollutant output, and lessens habitat disruption from fossil‑fuel extraction.
Real‑World Examples
| Problem Group | Case Study | Key Impact |
|---|---|---|
| Pollution | Great Pacific Garbage Patch | Over 1.8million tons of plastic debris harming marine species. |
| Climate Change | Arctic Sea‑Ice Decline | Sea‑ice extent down 13% per decade, threatening indigenous livelihoods. |
| Biodiversity Loss | Amazon Deforestation (2024) | ~7,500km² cleared, driving up species extinction risk. |
What You Can Do - A Practical Checklist
- Reduce waste: Choose reusable containers, avoid single‑use plastics, and support recycling programs.
- Cut carbon footprint: Use public transport, cycle, or walk; switch to a green energy supplier; improve home insulation.
- Support biodiversity: Plant native species, protect local wetlands, and back NGOs working on habitat restoration.
- Get involved: Volunteer for beach clean‑ups, join citizen‑science projects, or attend town‑hall meetings on climate policy.
- Educate others: Share facts on social media, host community workshops, or incorporate sustainability topics into school curricula.
Frequently Asked Questions
Why are the three problem groups grouped together?
They capture the majority of measurable environmental damage and overlap in causes and solutions, making them a practical framework for policy and action.
Can one solution address more than one group?
Yes. For example, planting trees sequesters carbon (climate), improves air quality (pollution), and provides habitat (biodiversity).
How fast is biodiversity loss compared to the other groups?
It’s the fastest‑declining of the three; vertebrate populations have dropped nearly 70% in the last five decades, a steeper rate than the rise in global CO₂ levels.
What are the most common pollutants in the UK?
Fine particulate matter (PM₂.₅), nitrogen dioxide from traffic, and ammonia from agriculture top the list.
Where can I find reliable data on these problem groups?
Trusted sources include the IPCC, WHO, WWF Living Planet Report, and the UK’s Environment Agency dashboards.